WHAT LIES BENEATH?
FishTec charts reveal Jozini’s secrets
By Erwin Bursik and John Easton
[Originally published in the November 2022 issue of SKI-BOAT magazine]
IT’S nothing short of amazing! Soon after I popped the FishTec HD fishfinding chart into the slot in the Lowrance HD510 on Mr. SKI-BOAT, up popped the full, detailed chart.
It showed incredible images not only of the contour lines of Jozini Dam in northern KwaZulu-Natal, but superimposed on it was also the “snail trail” of my personal wanderings on this large lake during the last two Tigerfish Bonanza Tournaments I have attended.
 Guess what? The way points and trails I had marked on the previously blank screen were superimposed exactly where they should be on the new FishTec chart. Mind blowing!
John Easton, an independent cartography expert and CEO of FishTec HD Fishing Charts, has done the detailed mapping of most of the inland waters of South Africa, and while I had noticed some of his work on social media, I had not paid detailed attention as I didn’t think further than believing it was not directed at offshore ski-boating.
To be honest, I didn’t even give a thought to its possible application on Jozini Dam.
When John sat in my office with his Elite 9 Lowrance and started to throw up images on my big computer screen of his very first FishTec chart of Jozini, I was spellbound.
There, right before my eyes, were the full views of the entire lake and the Pongola River as it runs past the bridge on Kim Landman’s Pongola Reserve. It also showed the full details of the old (pre-dam wall) course of this river along with the pre-existing railway lines which ran through the area prior to the damming of the Pongola River.
As he zoomed in on various areas, John highlighted many of the “special spots” I have acquired during the last almost two decades of fishing the Tigerfish Bonanza. I was amazed at just how incredibly accurate the map was. When fully zoomed in on certain areas, the tilapia breeding rings could even be clearly seen, as well as what seem to be pre-existing reed beds that still exist. Apparently they have produced some great tigerfishing for John who is renowned for his light tackle fishing on inland waters.
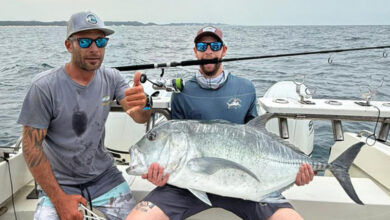
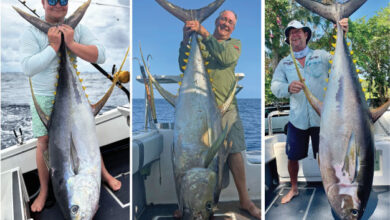
This article was written prior to the 2022 Tigerfish Bonanza which is featured elsewhere in this issue of SKI-BOAT, and I’m trusting that the info that is now loaded on my sounder will enable me to improve my score at this exciting event.
 At this stage I would be naïve to think I could properly explain the more technical aspects of John’s chart of Jozini and how he does it with the AIMy — the autonomously guided craft he has personally designed and built.
My mind is already jumping into the future and wondering whether there is an application for this advanced cartography in the inshore area — say up to 50m — of South Africa’s shoreline.
Can you just imagine, for example, what Sodwana Bay would look like on one’s sounder screen when you view the few images shown alongside of what Jozini looks like using this technology?
Before I get carried away, I’ll let John expplain more about Jozini and the finer details of this technology…
STATISTICS
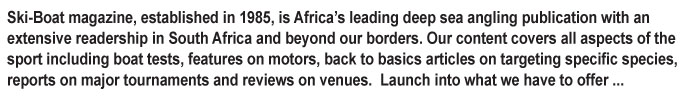
Jozini is the fifth largest dam in South Africa, with an area of well over 30 000 acres when full. In August 2022, when the survey was carried out, it was sitting just on 30 000 acres at 82% of its capacity which is around 6ft or 2m below full capacity. The deepest part of the dam is obviously the gorge at 190ft or 60m.
The dam demands some very healthy respect from a danger aspect, as the main body of the dam, which is around 30km in length from north to south, offers very little shelter. The river section is a popular fishing area and makes up approximately 2 600 acres or 8% of the dam, while the gorge is an area of around 1 600 acres or 5% of the dam.
BATHYMETRY SURVEY
The primary objective of the FishTec bathymetry survey was to create a contour chart of the dam using a very narrow beam transducer for accurate depth measurement. This survey is the first time since the dam was built, that accurate sediment, depth and volume data has been captured for the entire dam, which will still be relevant for many years to come.
For example, according to the records, the total capacity is just shy of 2.5 billion cubic metres, and at the current 82%, that should equate to 2.005 billion cubic metres. However, the capacity is now 1.963 billion cubic metres which means that, due to silting, nearly 50 million cubic metres of capacity has been lost over the years.
SURVEY EQUIPMENT
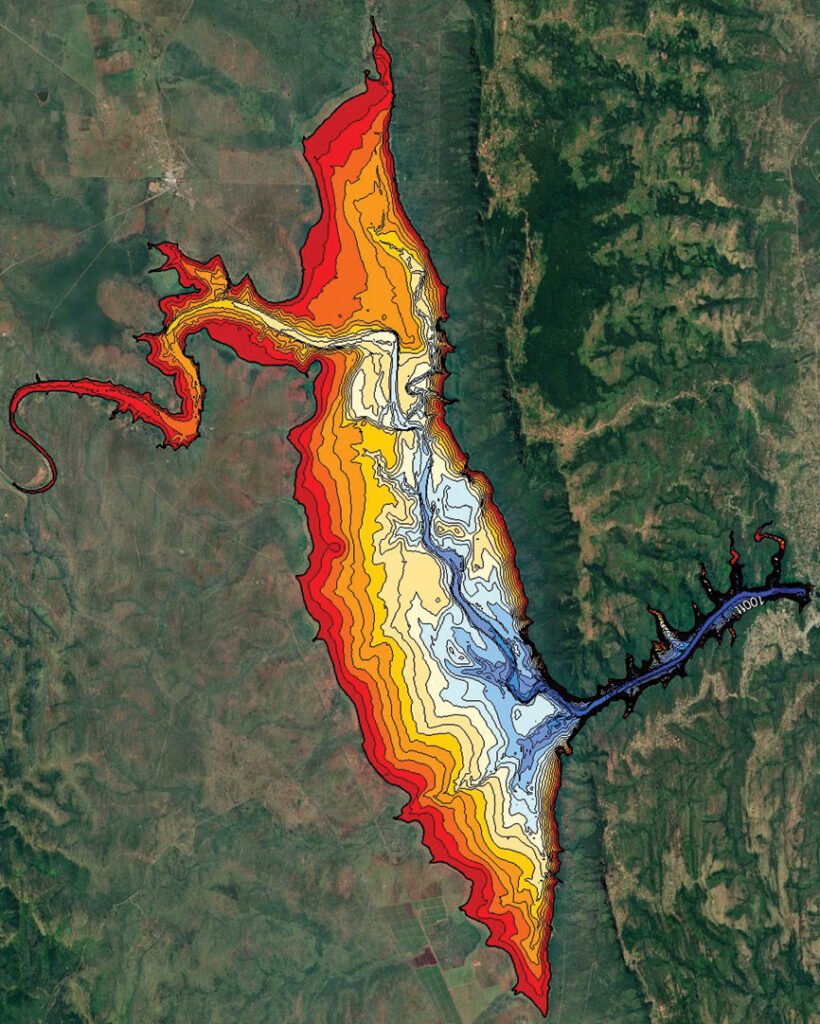
A unique aspect of this survey is that the majority of the dam was surveyed using a hydrone which has been in development by FishTec since 2016. Instead of having a human erratically driving a craft designed to plane on the water, which creates all sorts of sonar issues, this craft acts more like an extension of the transducer by riding in, instead of on, the water. This concept offers high-quality sonar data at good speeds even in windy or choppy conditions.
The unique craft is creatively named AIMy which stands for ‘My Artificial Intelligence Mapping’. She is a 4.3m delta design powered by a 5hp four-stroke outboard motor capable of semi-submersible operation should the conditions get wild enough.
As far as we are aware, this is a first of its kind for this specific feature. AIMy is capable of running completely autonomously while being tracked by 4G on a cellphone from anywhere in the world for as long as the batteries and fuel can last, which is around 12 hours.
 THE CHART
The chart itself is encrypted for copy protection to a micro SD card in a full SD card adaptor and comes in a jewel case for protection.
The card includes the following charts:
• Jozini 82% — 2m
• Sediment
• Mosaic
• NorthHC
• SouthHC
• MidHC
• RiverHC
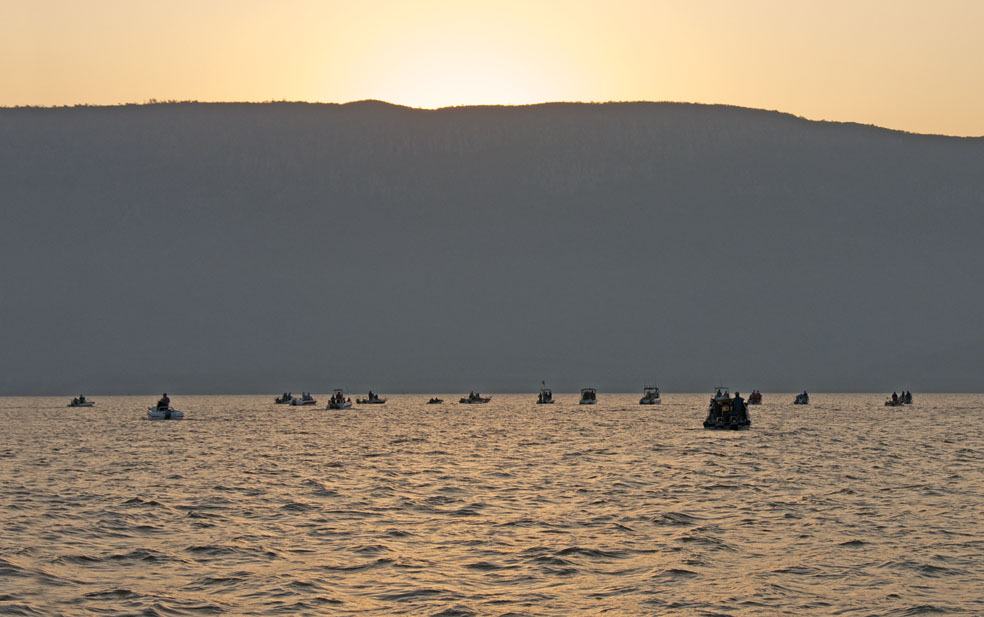
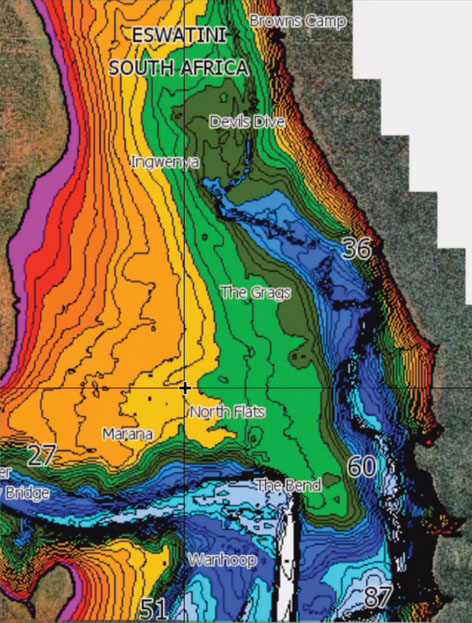
Jozini 82% — 2m Chart
This is the primary chart for the entire dam and includes 10ft interval major contours with coloured isobaths which can be turned on and off individually under Chart Options and Categories. There are labels for some key locations around the dam as well as the South Africa–Eswatini border. At the main launch site there is a “Sponsors” area where users can click on a specific name and an image of that business’s advert will pop up if you tap on it.
The chart also includes a free satellite background of when the dam was down and around 30-40ft. Coupled with the precision contour lines overlay, this makes it very easy to determine what depth those points of interest are in when you are sitting at home studying the chart on your Lowrance chart plotter. As Benjamin Franklin said, “By failing to plan, you are preparing to fail.”
Sediment Chart (DWAF)
A major feature of the Jozini chart is that it includes a calibrated Department of Water Affairs & Forestry (DWAF) Sediment chart that shows exactly what was in the valley prior to the dam wall being built.
The biggest problem with these old charts is that one had no idea where the shoreline was and at what depth the points of interest were in. Now that FishTec has placed precision contours as an overlay, this is no longer a problem. In addition, colour isobaths can be turned on and off depending on the depth range you are targeting, making it all very easy to understand.
Sidescan Mosaic Chart
The river section was also surveyed using a smaller hydrone, which not only captured depth data but sidescan sonar as well, which is labelled as “Mosaic” on the chart. This shows very detailed imagery of rocks, timber, weeds, spawn beds, ledges, old buildings, sunken boats etc. which comes in very handy when putting a game plan together.
High Contrast (HC) Charts
High contrast charts like the one above offer 3ft major contour intervals and 1ft minor contour intervals to give very precise structure detail of the bottom while the high contrast isobaths make it easy to maintain a targeted depth range.
The dam has been split into four sections in order to offer the best contrast for the specific depth range of that area — North, Mid, South and River. Each of these also includes a low level satellite background and area labels.
SITUATIONAL AWARENESS
Wikipedia says, “Situational awareness or situation awareness (SA) is the perception of environmental elements and events with respect to time or space, the comprehension of their meaning, and the projection of their future status.”
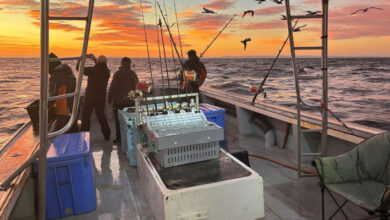
When you’re on a body of water such as Jozini, situational awareness and safety have to be on your mind before you even launch your boat. Many anglers prefer to use a charter service on Jozini, depending on the local knowledge/situational awareness of the skipper, not only with regard to the best fishing spots but for safety as well.
Charts go a long way to contributing to your situational awareness if you take the time to study them before going on your fishing trip or tournament. Over the past 10 years, watching anglers that use FishTec HD Fishing Charts, it is clear as day how their situational awareness and fishing success has improved in comparison to those who do not use the charts.
FAQ
Q: What format is the chart in?
A: The chart is encrypted onto an SD card for Lowrance units only.
Q: Which Lowrance units are compatible?
A1: For contour only, any Lowrance chart plotter from LMS to the latest entry-level Hook (not ‘X’ models).
A2: For full imagery (sediment, satellite, sidescan mosaic) any Lowrance unit from HDS Gen2 and EliteTi up and to the latest EliteFS and HDS Live units.
Q: Can I view the chart on my PC or laptop?
A: No, but all Lowrance units from HDS Gen3 and EliteTi have WiFi, so using the Lowrance Link App, you can use your phone, tablet or even full HD TV to view and plan your fishing trips and tournaments.
Q: Can I save waypoints while using the Link App?
A: Yes, anything you can do on your unit you can do via the App, except for controlling an autopilot for obvious safety reasons.
Q: Can I use Genesis Live while my FishTec chart is in the unit?
A: No. Any form of writing to the card can damage the encryption and corrupt the data.
Q: How do I backup my waypoints if I’m using a FishTec Chart?
A: Remove the FishTec chart and insert a blank formatted SD card, then export your waypoints to that.
Q: How do I order a FishTec Chart?
A: Contact Lowrance SA on 031 368-6649, phone Colleen on 0824460914 or email <sales@fishtec.co.za>.